STAGED DRAFT FOR REVIEW · CASE STUDIES V2 · NOT LINKED FROM THE LIVE SITE
Case study: management reporting

The reporting layer that turns CRM data into management decisions

Quadrant's CRM held the data. The questions management actually asked needed a reporting platform of their own, so HPCR built one over the HubSpot data.
Client
Quadrant Farming Solutions
Delivered
Dedicated management reporting platform over HubSpot CRM data
Coverage
Sales activity, stockist onboarding, management attention, commercial pipeline
Role in the system
The decision layer over everything else
01

The problem

Management's questions were specific: what did each sales representative actually do this week, how does it compare with last week, which stockists are engaging with onboarding, where is the pipeline sitting and ageing, and what deserves attention next. HubSpot's standard reporting, built to serve a broad market, did not adequately answer questions this specific to the business.
02

What HPCR identified

The gap was not more charts; it was reporting designed around the management meeting. HPCR identified the questions leadership needed answered, then designed a dedicated reporting platform to answer exactly those, reading from the same HubSpot data the team already maintains. No re-entry, no exports, no spreadsheet assembly before each meeting.
03

What HPCR built

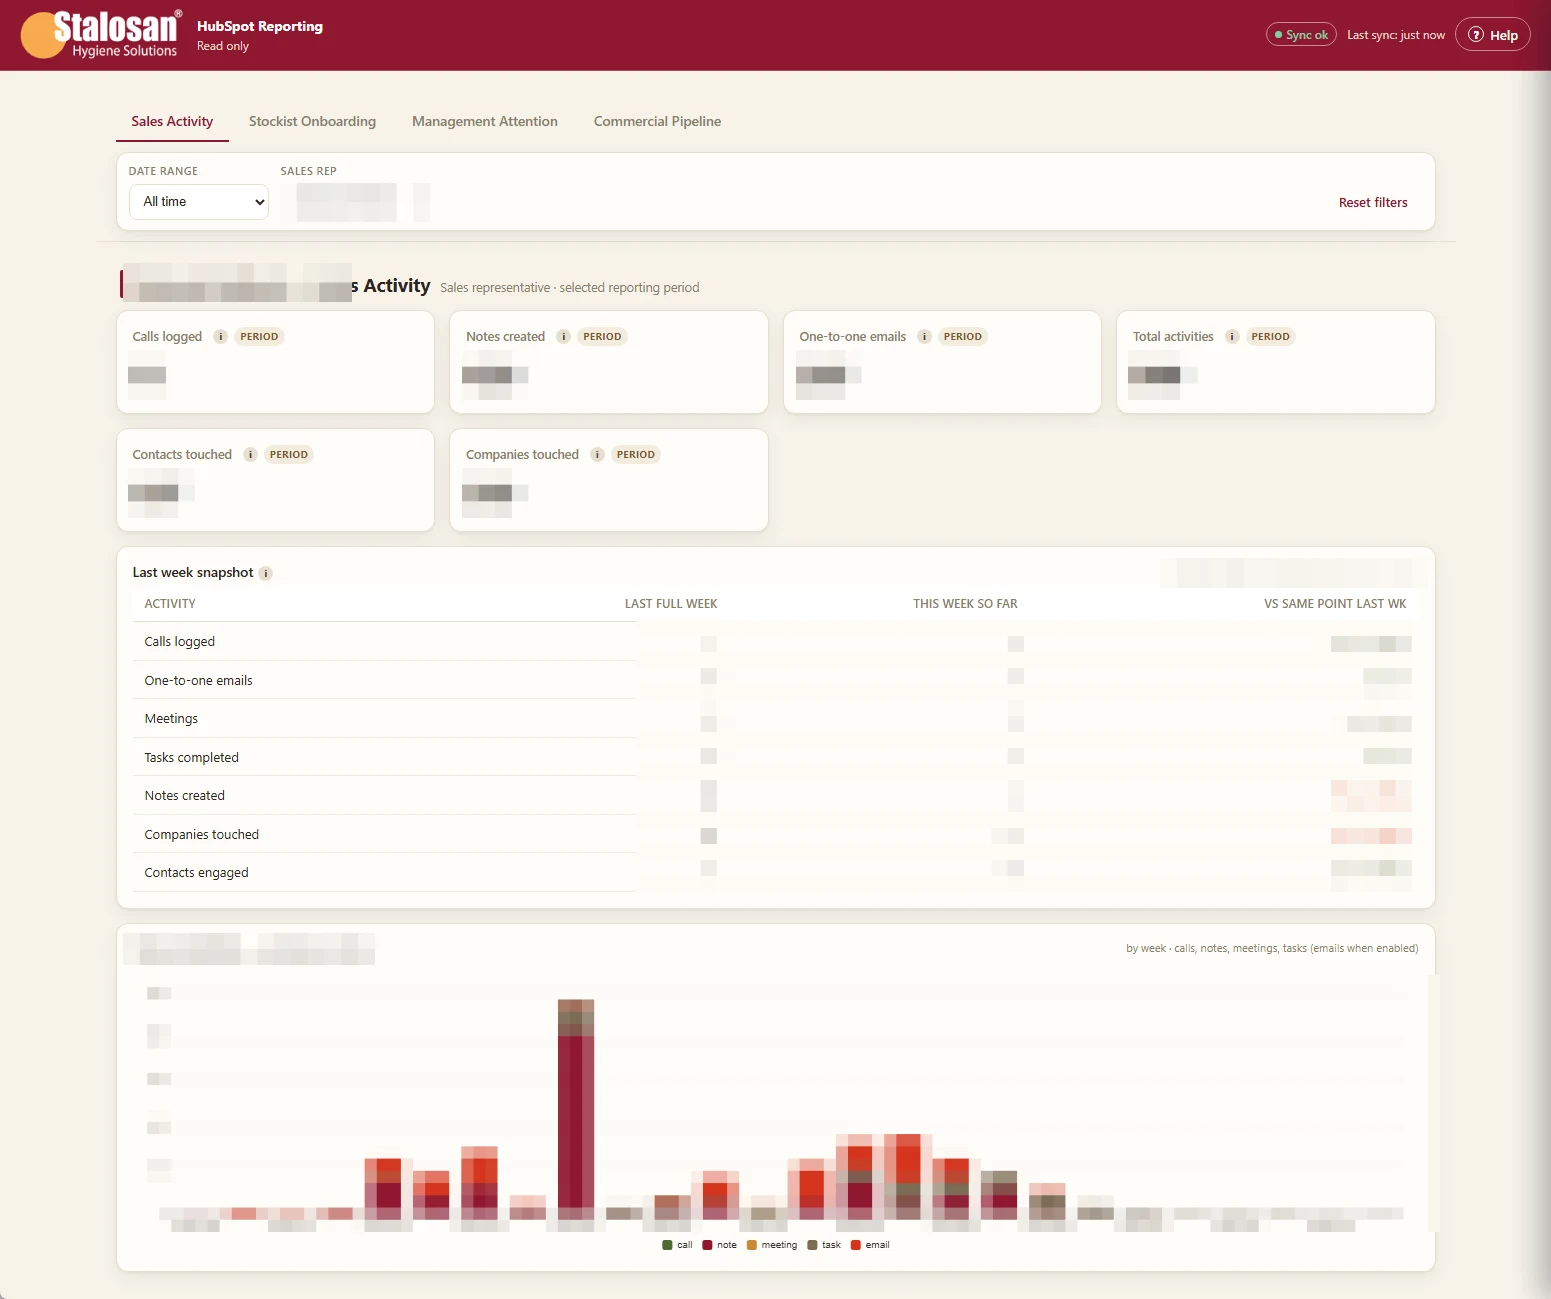
A dedicated, read-only reporting platform over the client's HubSpot data, organised the way management thinks: sales activity by representative with weekly snapshots and week-over-week movement, stockist onboarding engagement, the commercial pipeline at any point in time, and a management attention view that surfaces where focus is needed next.
Because the platform is custom, it answers the business's questions in the business's language, and new questions become new views rather than new software.
Custom HubSpot reporting dashboard, client data obscured
The reporting platform over HubSpot data. Client data obscured.
SCREENSHOT PLACEHOLDER · FOR REVIEW · NOT FOR PUBLICATION

Weekly sales-representative snapshot

REQUIRED SCREENSHOT
The weekly activity snapshot for one representative: this week beside last week with movement
INTENDED PROJECT
Quadrant HubSpot reporting platform
INFORMATION VISIBLE
Activity metrics (calls, notes, emails, contacts and companies touched) for a fictional representative, with week-over-week deltas
ASPECT RATIO
16:10
CROP
Snapshot table and metric tiles; exclude surrounding navigation
DEMONSTRATION DATA
Yes: fictional representative name and demonstration metrics
SANITISATION
Demonstration data strongly preferred over redacting the real capture
DESKTOP TREATMENT
Dominant image, approx 72 percent width
MOBILE TREATMENT
Full width; tiles must stay legible
SCREENSHOT PLACEHOLDER · FOR REVIEW · NOT FOR PUBLICATION

Management-attention screen

REQUIRED SCREENSHOT
The Management Attention tab: what the platform says deserves focus next
INTENDED PROJECT
Quadrant HubSpot reporting platform
INFORMATION VISIBLE
Attention items or flags with the reason each was raised, on demonstration data
ASPECT RATIO
16:10
CROP
The attention list with two to four visible items
DEMONSTRATION DATA
Yes: demonstration records
SANITISATION
Required if any real stockist or prospect names appear
DESKTOP TREATMENT
Dominant image, approx 72 percent width
MOBILE TREATMENT
Full width
04

How it connects

Every other layer of the Quadrant system feeds this one. The websites and calculators create enquiries, the onboarding sequence records stockist engagement, the sales team's activity lands in the CRM, and the reporting platform reads it all in one place. It is the layer that makes the rest of the system measurable.
SCREENSHOT PLACEHOLDER · FOR REVIEW · NOT FOR PUBLICATION

Drill-down: metric to underlying activity

REQUIRED SCREENSHOT
One complete sequence, three frames: a metric tile, the click-through list, and the underlying activity record (one logged email, call or note)
INTENDED PROJECT
Quadrant HubSpot reporting platform
INFORMATION VISIBLE
The same number traced from summary metric to the record behind it, ending at a single activity with type, timestamp and fictional company and contact; demonstrates the reporting is inspectable end to end
ASPECT RATIO
Three frames at 4:3 each, presented as a numbered sequence
CROP
Tight on the metric, the list and the one record
DEMONSTRATION DATA
Yes: demonstration data throughout, fictional names at every step
SANITISATION
Mandatory if real company names or correspondence appear at any step
DESKTOP TREATMENT
Three-step sequence row with step numbers, full band width
MOBILE TREATMENT
Stacked vertically in order

05

What changed

Leadership now steers with data: which campaigns engage stockists, where the pipeline sits and what deserves attention next, from a live platform rather than assembled spreadsheets. The specific figures involved are the client's own performance data, so we do not publish them, and we apply the same discretion to every client.
RELATED

See your pipeline clearly

Tell us the three questions your management meeting cannot currently answer. We will show you the reporting that would answer them.